Elastic SIEM Installation lab
Security information and event management (SIEM) is a subsection within the field of computer security, where software products and services combine security information management (SIM) and security event management (SEM). They provide real-time analysis of security alerts generated by applications and network hardware.
There are several well-known SIEM software available in the market but the only issue is they are a privilege to have and are on the expensive side on the cost spectrum. So in this article, we try to solve the very same problem.
ELK or Elastic stack is a set of several opensource tools specialized for centralized logs which makes it handy to search, analyze, and visualize logs from different sources.
Here we configure this on Ubuntu but it can be configured on any Linux or Windows machine with ROOT privileges.
Elastic SIEM Architecture

We’ll be using Beats to ship the logs to logstash through a pipeline which then will be fed to elasticsearch and will be visualized through kibana.
Kibana and elasticsearch will be deployed through Nginx as it allows small persistent connections, load balancing like features that make it stable in the long run.
PREREQUISITES
- Java dependencies
- File beats
- Logstash
- Elasticsearch
- Kibana
- Nginx
- Open ssl ( as we will be shipping the data throughout an encrypted channel )
INSTALLATION AND CONFIGURATION PROCESS
To acquire system root use
Sudo -s
Java Dependencies
Elasticsearch requires Java in our running machine. To install Java along with the HTTPS support and wget packages for APT Use the following command
apt install -y openjdk-11-jdk wget apt-transport-https curl
Installing Elasticsearch
Note: If the following method does not work for you or in case you need a different version then please refer to elasticsearch’s official documents.
Start by importing Elasticsearch public key into APT. To import the GPG key enter the following command:
wget -qO - https://artifacts.elastic.co/GPG-KEY-elasticsearch | apt-key add –
Then Add Elastic repository to the directory sources.list.d
echo "deb https://artifacts.elastic.co/packages/6.x/apt stable main" | tee -a /etc/apt/sources.list.d/elastic-6.x.list
Now update and install elasticsearch using
Sudo apt-get update && sudo apt-get install elasticsearch
Configuring Elasticsearch
By default, Elasticsearch listens for traffic on port 9200. We are going to restrict outside access to our Elasticsearch instance so that outside parties cannot access data or shut down the elastic cluster through the REST API.
In order to do so, we need to do some modifications in the Elasticsearch configuration file – elasticsearch.yml.
nano /etc/elasticsearch/elasticsearch.yml
In the network, section uncomment the network.host and http.port

Now, start and enable Elasticsearch services
systemctl start elasticsearch
systemctl enable elasticsearch
verify the status if Elasticsearch.
systemctl status elasticsearch
curl -X GET "localhost:9200"
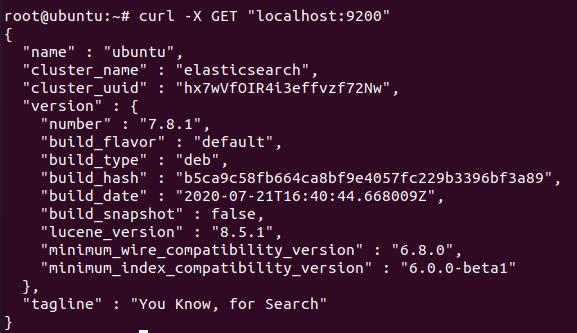
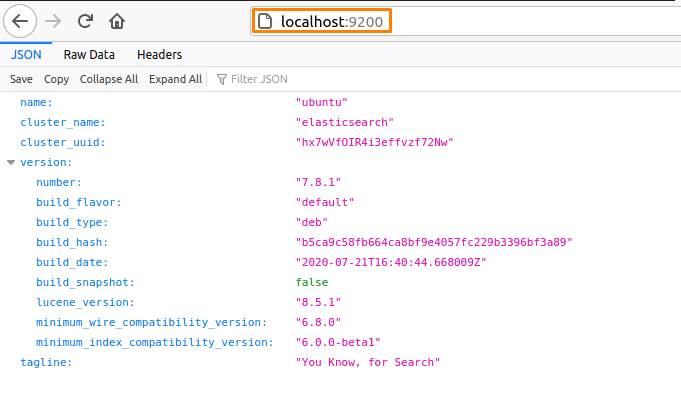
As mentioned above elasticsearch listens on port 9200 so you can verify in the browser also.
Installing logstash
First Let’s confirm OpenSSL is running and then install Logstash
openssl version -a
apt install logstash -y

Edit the /etc/hosts file and add the following line
127.0.0.1 elk-cluster.Now generate an SSL certificate to secure the log data transfer from the client Rsyslog & Filebeat to the Logstash server.
mkdir -p /etc/logstash/ssl
cd /etc/logstash/
openssl req -subj '/CN=elk-master/' -x509 -days 3650 -batch -nodes -newkey rsa:2048 -keyout ssl/logstash-forwarder.key -out ssl/logstash-forwarder.crt
Now, we need to create new configuration files for Logstash also know al pipelines named ‘filebeat-input.conf’ as input file from filebeat ‘Syslog-filter.conf’ for system logs processing, and ‘output-elasicsearch.conf’ file to define Elasticsearch output.
cd /etc/logstash/
nano conf.d/filebeat-input.conf
input {
  beats {
    port => 5443
    type => syslog
    ssl => true
    ssl_certificate => "/etc/logstash/ssl/logstash-forwarder.crt"
    ssl_key => "/etc/logstash/ssl/logstash-forwarder.key"
  }
}
For the system log data processing, we are going to use a filter plugin named ‘grok’. Create a new conf. file ‘Syslog-filter.conf in the same directory
nano conf.d/syslog-filter.conf
filter {
  if [type] == "syslog" {
    grok {
      match => { "message" => "%{SYSLOGTIMESTAMP:syslog_timestamp} %{SYSLOGHOST:syslog_hostname} %{DATA:syslog_program}(?:\[%{POSINT:syslog_pid}\])?: %{GREEDYDATA:syslog_message}" }
      add_field => [ "received_at", "%{@timestamp}" ]
      add_field => [ "received_from", "%{host}" ]
    }
    date {
      match => [ "syslog_timestamp", "MMM  d HH:mm:ss", "MMM dd HH:mm:ss" ]
    }
  }
}
last, create a configuration file ‘output-elasticsearch.conf’ for the output of elasticsearch.
nano conf.d/output-elasticsearch.conf
output {
  elasticsearch { hosts => ["localhost:9200"]
    hosts => "localhost:9200"
    manage_template => false
    index => "%{[@metadata][beat]}-%{+YYYY.MM.dd}"
    document_type => "%{[@metadata][type]}"
  }
}
Now start, enable & verify the status of Logstash service.
systemctl start logstash
systemctl enable logstash
systemctl status logstash
Installing Kibana
apt install kibana
Now we need to do some similar changes in kibana.yml file as we did in elasticsearch
nano /etc/kibana/kibana.yml
Now uncomment the following attributes
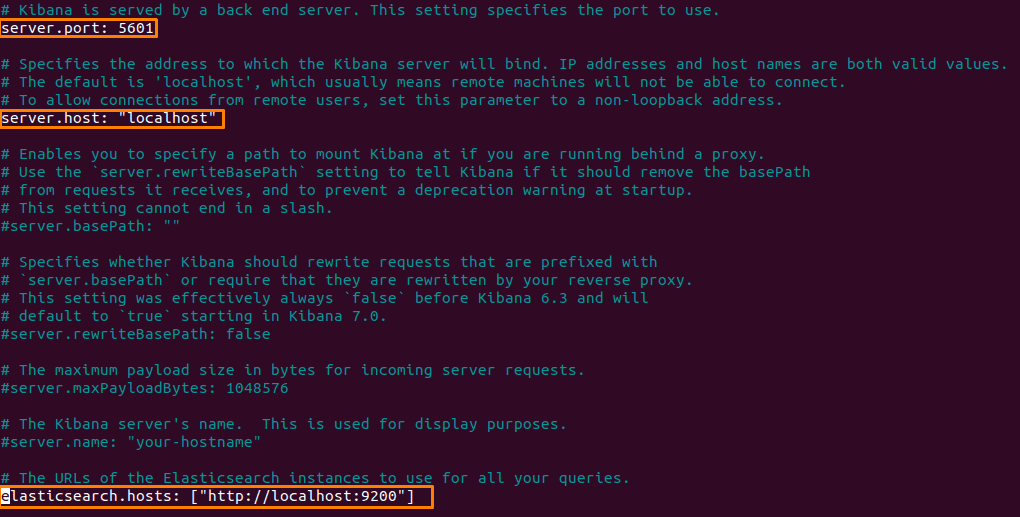
start & enable the kibana service:
systemctl enable kibana
systemctl start kibana
Install and Configure NGINX
Install Nginx and ‘Apache2-utlis’
apt install nginx apache2-utils -y
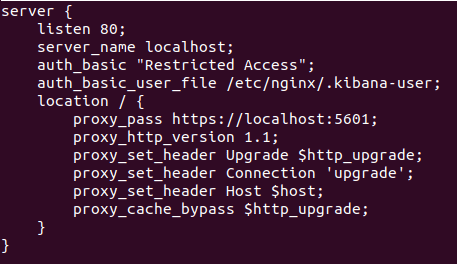
create a new virtual host file named Kibana.
nano /etc/nginx/sites-available/kibana
Paste the following
server {
    listen 80;
    server_name localhost;
    auth_basic "Restricted Access";
    auth_basic_user_file /etc/nginx/.kibana-user;
    location / {
        proxy_pass https://localhost:5601;
        proxy_http_version 1.1;
        proxy_set_header Upgrade $http_upgrade;
        proxy_set_header Connection 'upgrade';
        proxy_set_header Host $host;
        proxy_cache_bypass $http_upgrade;
    }
}
Now we need to create authentication for the Kibana Dashboard and activate the Kibana virtual host configuration and test our Nginx configuration
After that enable & restart the Nginx service.
sudo htpasswd -c /etc/nginx/.kibana-user elastic
ln -s /etc/nginx/sites-available/kibana /etc/nginx/sites-enabled/
nginx -t
systemctl enable nginx
systemctl restart nginx
Install and Configure Filebeat
apt-get update && apt-get install filebeat
open the filebeat configuration file named ‘filebeat.yml’
Nano /etc/filebeat/filebeat.yml
Enable the filebeat prospectors by changing the ‘enabled’ line value to ‘true’.

Next head to the Elasticsearch output section and add the following lines
hosts: ["your IP:9200"]
username: "elastic"
password: "123"
setup.kibana:
host: "your IP:5601"
Enable and configure the Elasticsearch module
sudo filebeat modules enable elasticsearch
sudo filebeat setup
sudo service filebeat start

Now copy the Logstash certificate file – logstash-forwarder.crt – to /etc/filebeat directory And restart filebeat
cp /etc/logstash/ssl/logstash-forwarder.crt /etc/filebeat/
sudo service filebeat restart
Routing the Logs to Elasticsearch
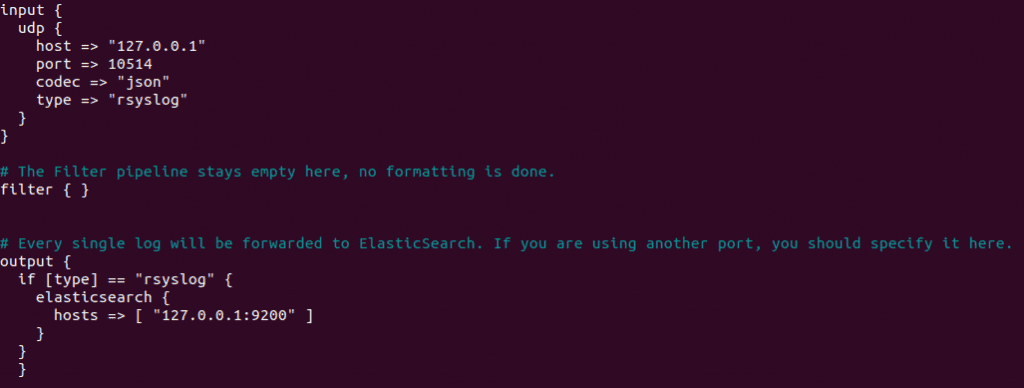
To route the logs from rsyslog to Logstash firstly we need to set up log forwarding between Logstash and Elasticsearch.
To do this we need to create a configuration file for Logstash
cd /etc/logstash/conf.d
nano logstash.conf
input {
  udp {
    host => "127.0.0.1"
    port => 10514
    codec => "json"
    type => "rsyslog"
  }
}

# The Filter pipeline stays empty here, no formatting is done.
filter { }

# Every single log will be forwarded to ElasticSearch. If you are using another port, you should specify it here.
output {
  if [type] == "rsyslog" {
    elasticsearch {
      hosts => [ "127.0.0.1:9200" ]
    }
  }
  }
Now restart the Logstash service
And to check that everything is working correctly
systemctl restart logstash
netstat -na | grep 10514

Routing from rsys to Logstash
Rsyslog can transform logs using templates to forward logs in rsylog, head over to the directory /etc/rsylog.d and create a new file named 70-output.conf
cd /etc/rsyslog.d
nano 70-output.conf
template(name="json-template"
  type="list") {
    constant(value="{")
      constant(value="\"@timestamp\":\"")     property(name="timereported" dateFormat="rfc3339")
      constant(value="\",\"@version\":\"1")
      constant(value="\",\"message\":\"")     property(name="msg" format="json")
      constant(value="\",\"sysloghost\":\"")  property(name="hostname")
      constant(value="\",\"severity\":\"")    property(name="syslogseverity-text")
      constant(value="\",\"facility\":\"")    property(name="syslogfacility-text")
      constant(value="\",\"programname\":\"") property(name="programname")
      constant(value="\",\"procid\":\"")      property(name="procid")
    constant(value="\"}\n")
}
Restart rsyslog service
systemctl restart rsyslog
curl -XGET 'http://localhost:9200/logstash-*/_search?q=*&pretty'
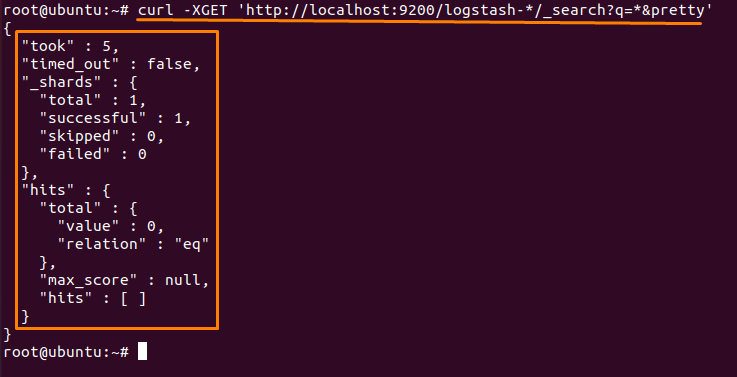
And the Elastic SIEM is complete. Now to visualize the logs and to segregate them according to your needs create index patterns the same as in other SIEM software available in the market.
As Elastic stack is open source and free to use the possibilities are quite endless.
Like their threat-hunting module or endpoint security module or even machine learning to automate the majority of tasks but more on that in future posts.


Recent Comments